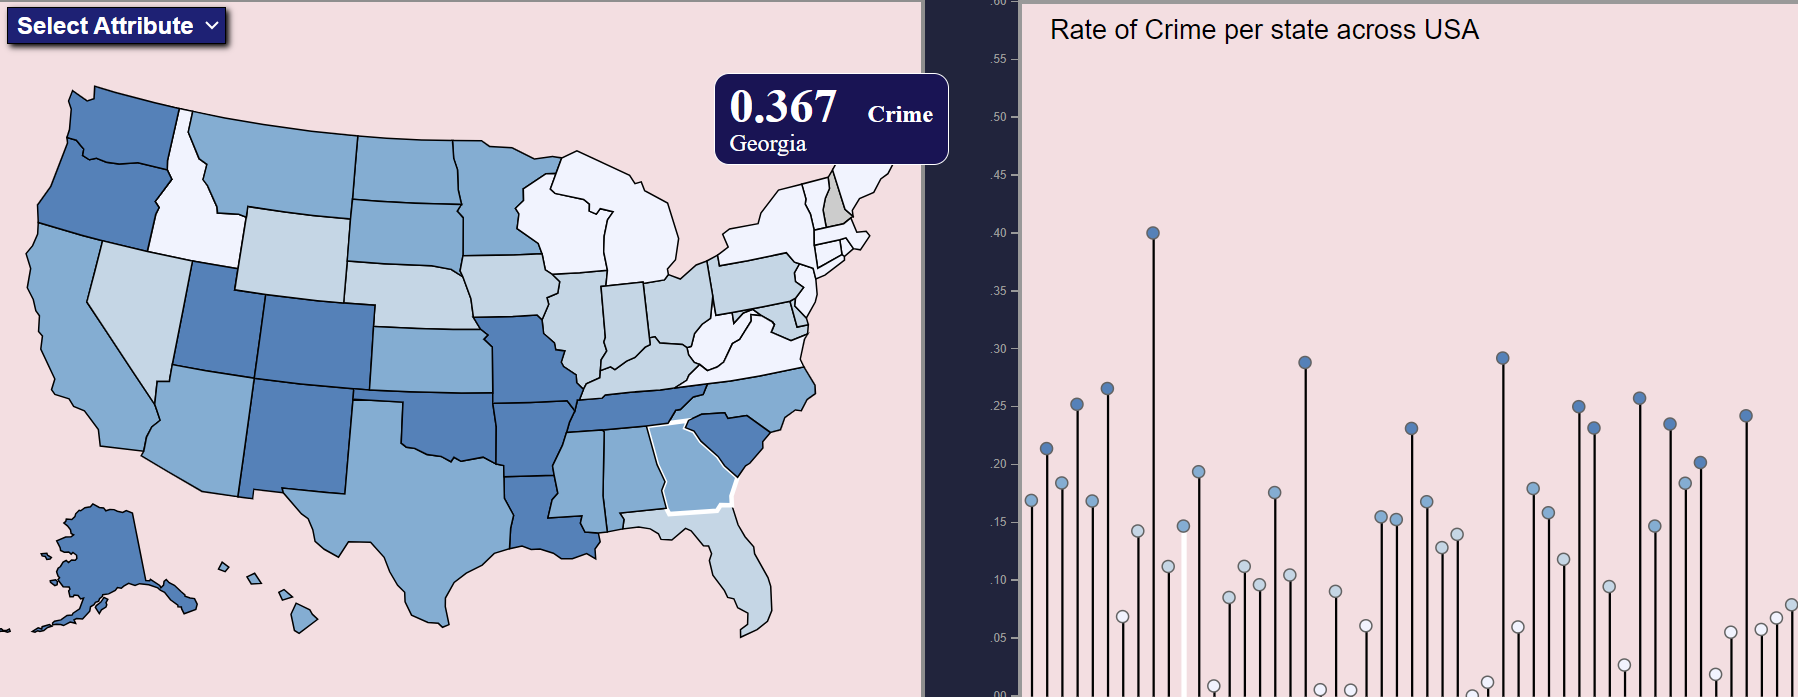
Crime Rate in USA
This project aims to visualize socioeconomic indicators such as poverty, literacy, population, and GDP leading to each state's crime rate. To achieve this goal, I use MAP and Dot line plot visualization techniques using D3 JavaScript to help illustrate the associations between these variables. As a result, gain valuable insights into the factors that contribute to crime rates in different regions of the USA, and use this information to inform policy decisions aimed at reducing crime rates and improving the overall well-being of citizens.
** Visit my GitHub to view the code for analysis steps and visualization.