Dane County(WI,USA) covid19 Analysis
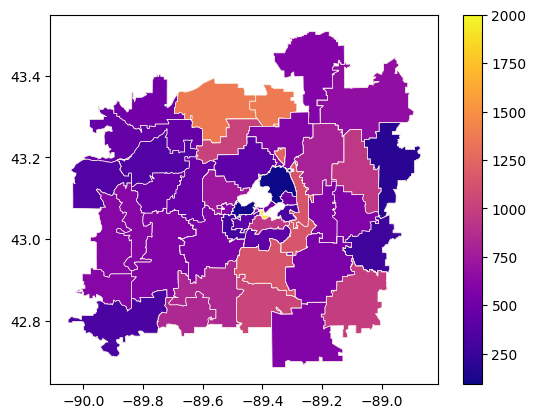
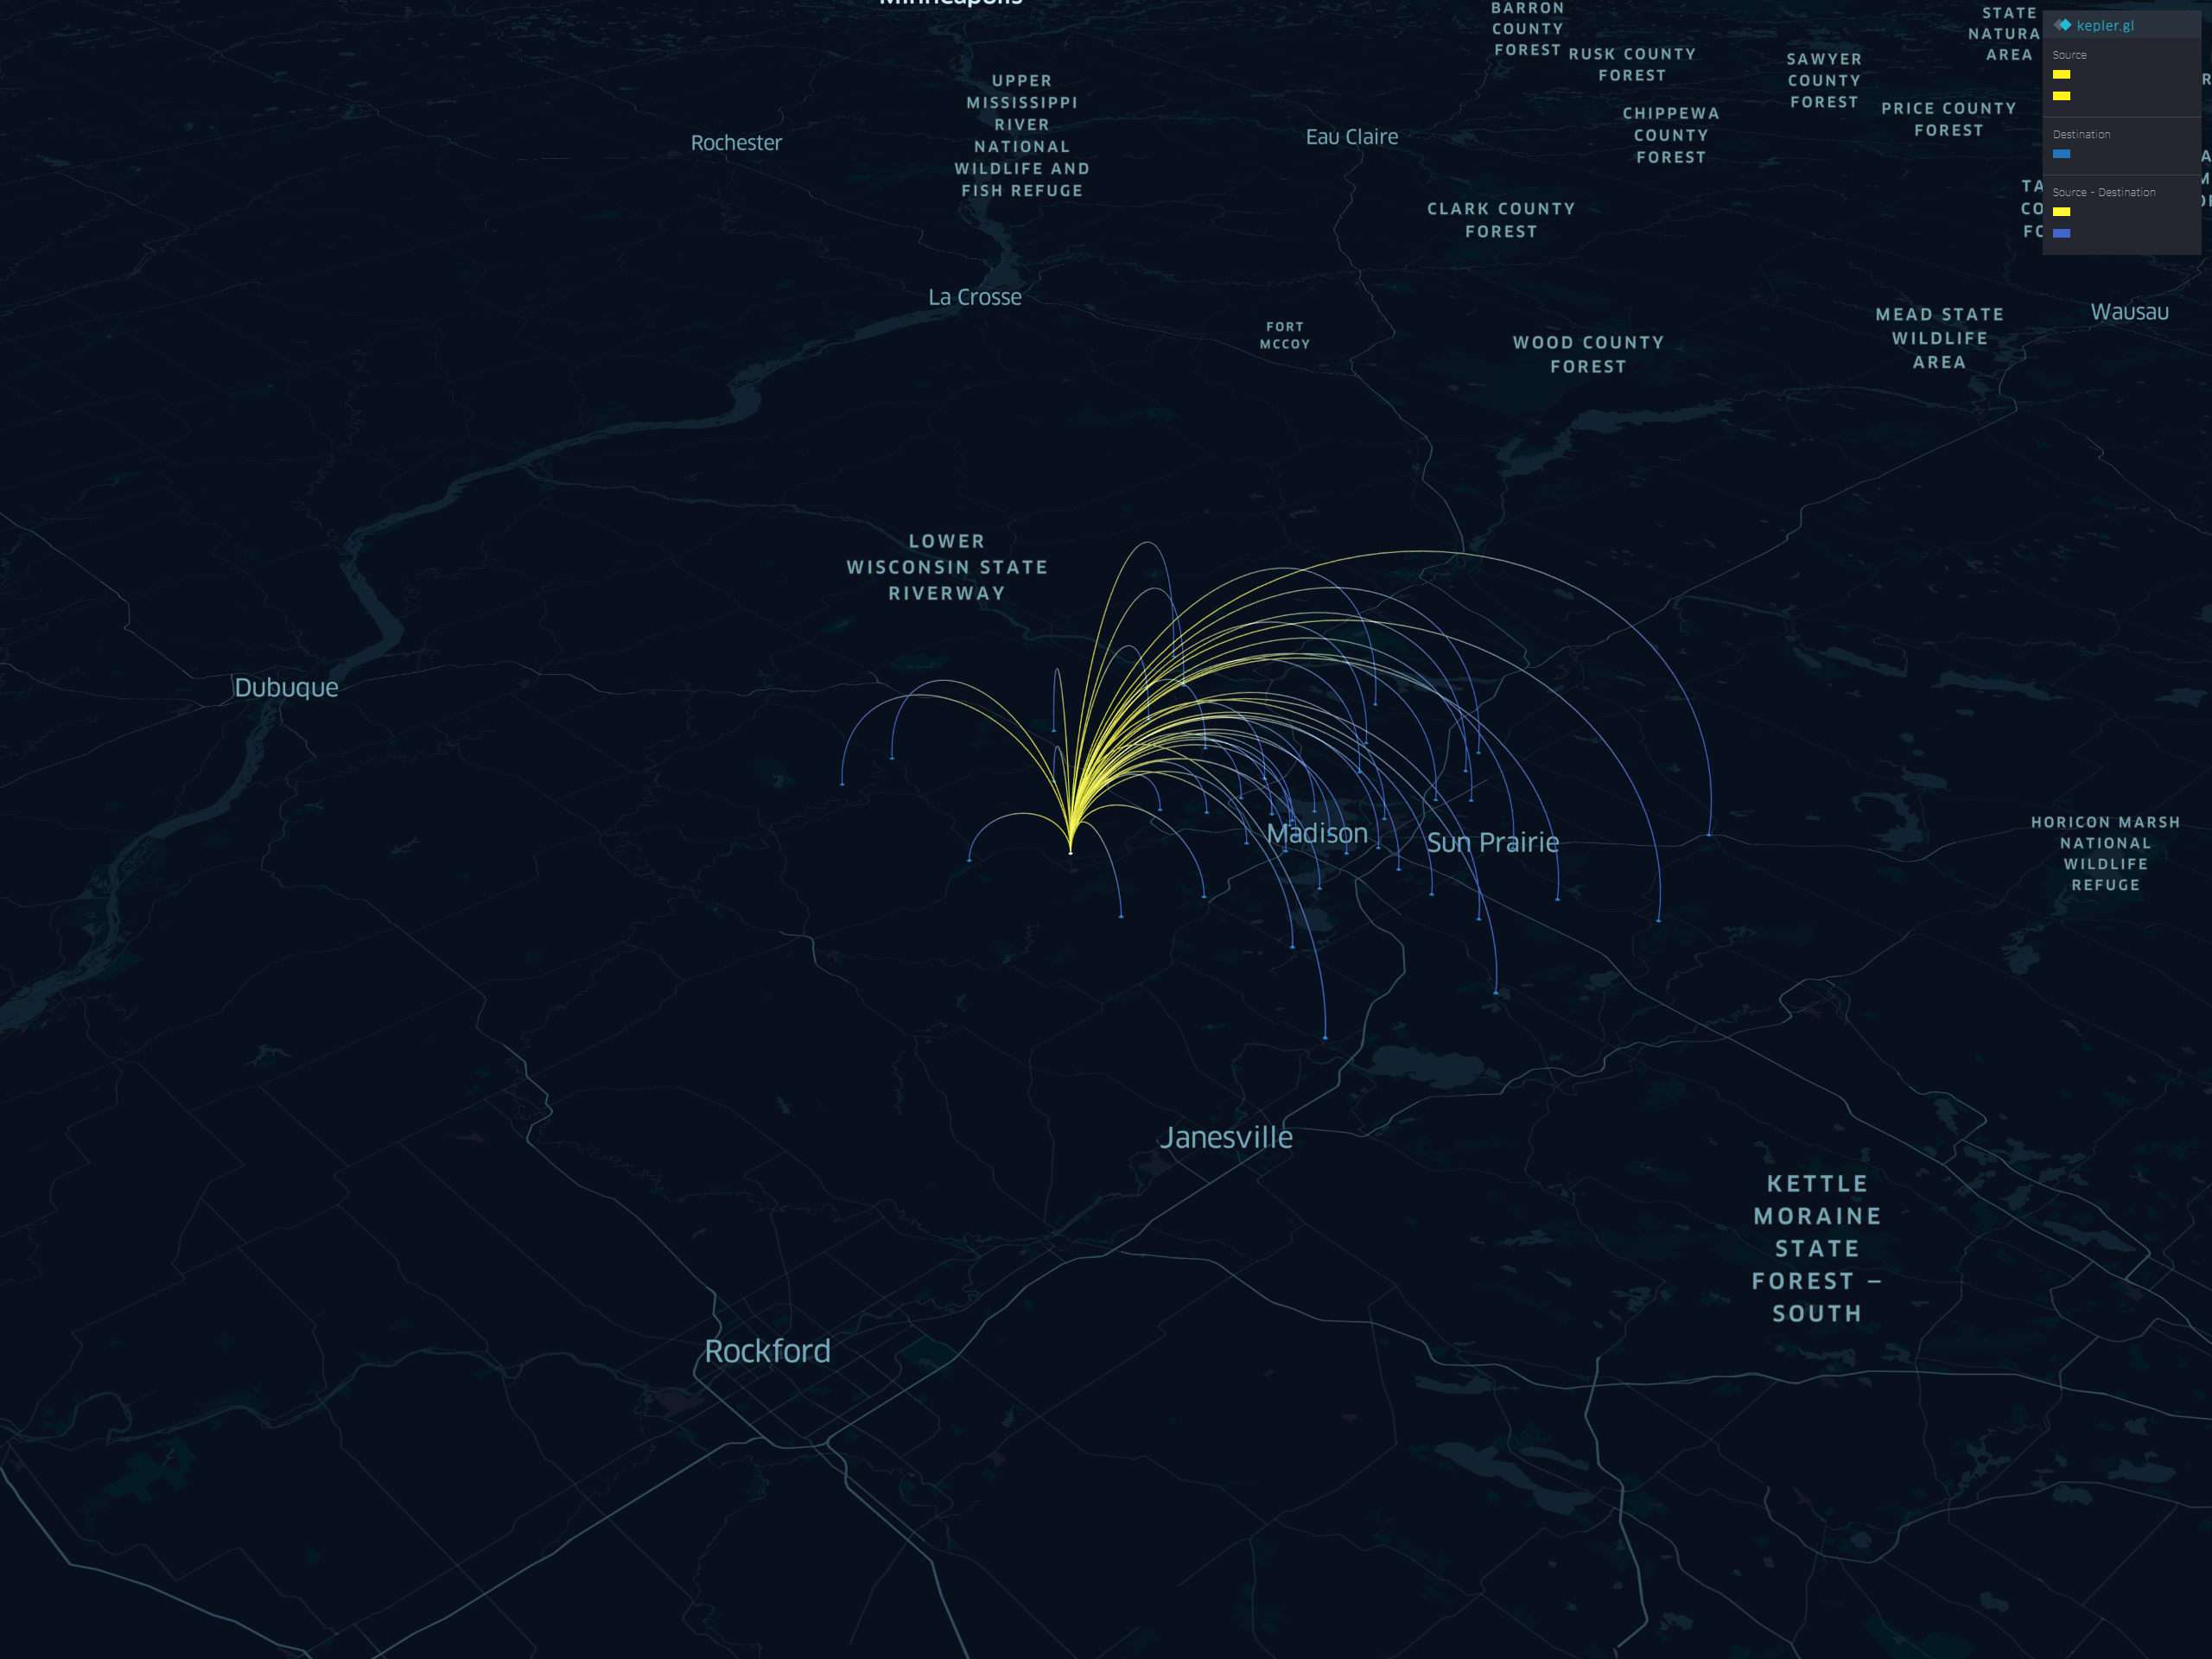
In this project, I developed a visualization of COVID-19 cases in Dane County, Wisconsin, by monitoring dynamic human mobility changes and travel flow patterns at various geographic scales. Understanding human behavior changes during the pandemic is crucial, and this project involved collecting both spatial and non-spatial structured data from the Dane County region, as well as related COVID-19 data. To process the data, I used Python libraries, specifically geopandas, to convert the data into the GeoJSON data format. For visualization of number of cases, I aggregated census tract information with ZCTA (Zip Code Tabular Areas) and appended COVID-19 information to this zip code information.
** Visit my GitHub to view the code for analysis steps and visualization.